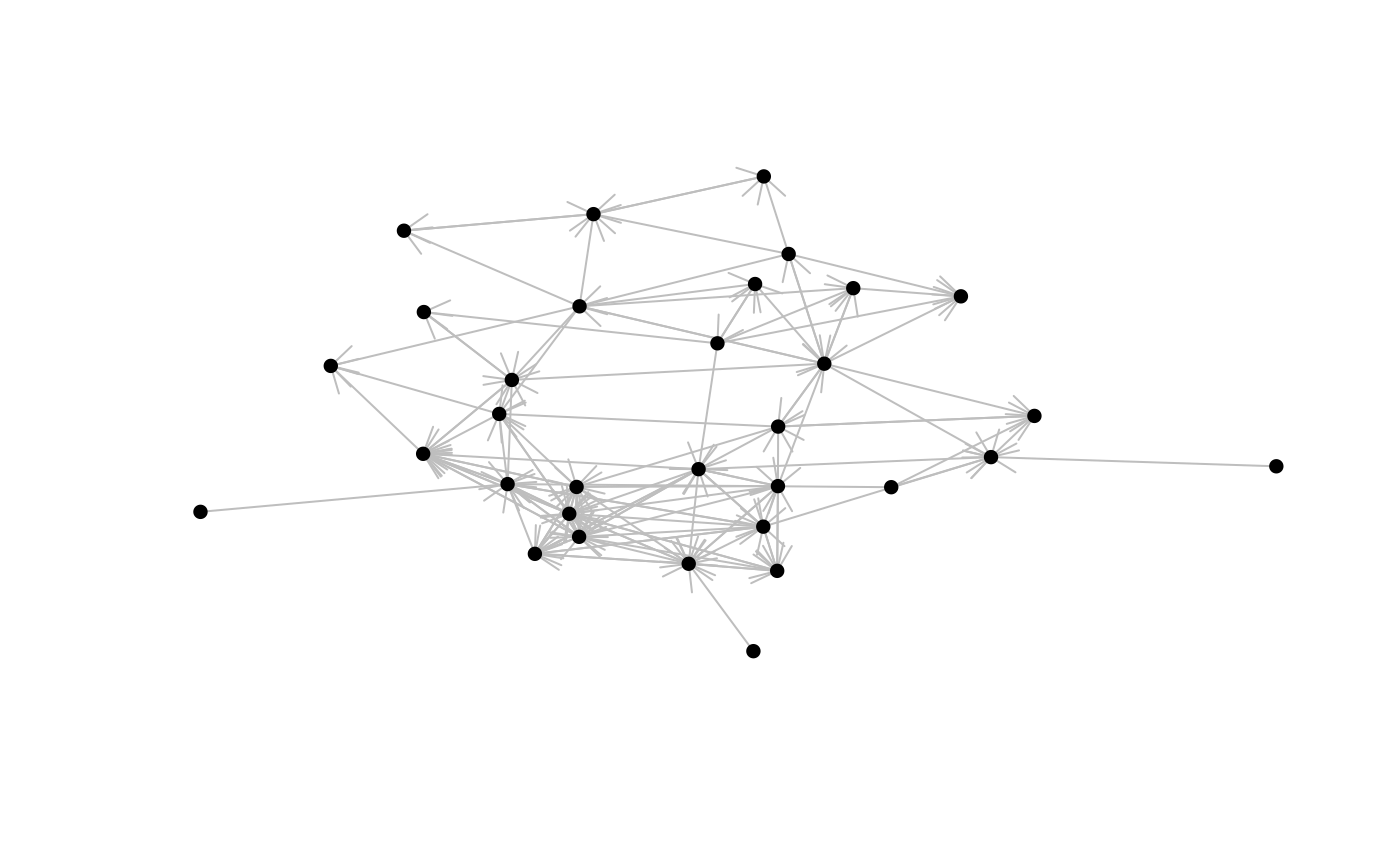
Plot the graph of a sociomatrix
netplot(Y,X=NULL,xaxt="n",yaxt="n",xlab="",ylab="",
 lcol="gray",ncol="black",lwd=1,lty=1,pch=16,bty="n",plotnames=FALSE,
 seed=1,
 plot.iso=TRUE,directed=NULL,add=FALSE,...)
Arguments
| Y | a sociomatrix |
|---|---|
| X | coordinates for plotting the nodes |
| xaxt | x-axis type |
| yaxt | y-axis type |
| xlab | x-axis label |
| ylab | y-axis label |
| lcol | edge color |
| ncol | node color (can be node-specific) |
| lwd | line width |
| lty | line type |
| pch | plotting character for nodes (can be node-specific) |
| bty | bounding box type |
| plotnames | plot rownames of Y as node labels |
| seed | random seed |
| plot.iso | include isolates in plot |
| directed | draw arrows |
| add | add to an existing plot region |
| ... | additional plotting parameters |
Author
Peter Hoff